# Dashboard
AppSealing collects metrics, events and hacking attempts from your Android and iOS application. AppSealing dashboard provides overall security insights of the mobile applications for a specific time period through various graphical representations and provides useful links for detailed information. This information can be used to monitor threats to the application sealed using AppSealing.
Application Hacking information represented is based on the threats which are detected across multiple regions on any device. It gives you glimps about security features that are necessary for your application.
To view ADC Dashboard (console) :
- Open the ADC console at https://console.appsealing.com (opens new window)
- Login with appsealing account credentials
- In the navigation pane, choose 'Dashboard'
Contents
# Metrics
The dashboard shows month-wise information about the Application selected by user. It provides you with the option to set filters on the metrics where you can opt for Operating System (default selected as Android) and Sealing Mode (app mode selected while sealing application)

| Metric | Description |
|---|---|
| Sealing Mode | Test - Test mode provides the same level of security, however a periodic 'Test mode' message is displayed on application Release - Release mode removes periodic message of 'Test mode', along with additional features like real time streaming, signing APK's, etc. |
| Operating System | OS Platform for which the application is sealed Android - Platform used to seal the Native or Hybrid Android apps using Console or CLI tool iOS - Platform used to seal the Native or Hybrid iOS apps using SDK tool |
| Application | Application for which metrics need to be shown, this list will be populated depending on Operating System selected |
| Period | The month selector for which metrics needs to shown |
# Monitoring
Dashboard monitoring contains overall analytical insights for application, that includes Threat Analytics, Real Time Streaming, Geographical distributions, Hacking Types and many more. Information is shown in tiles and each tile provides needful security information
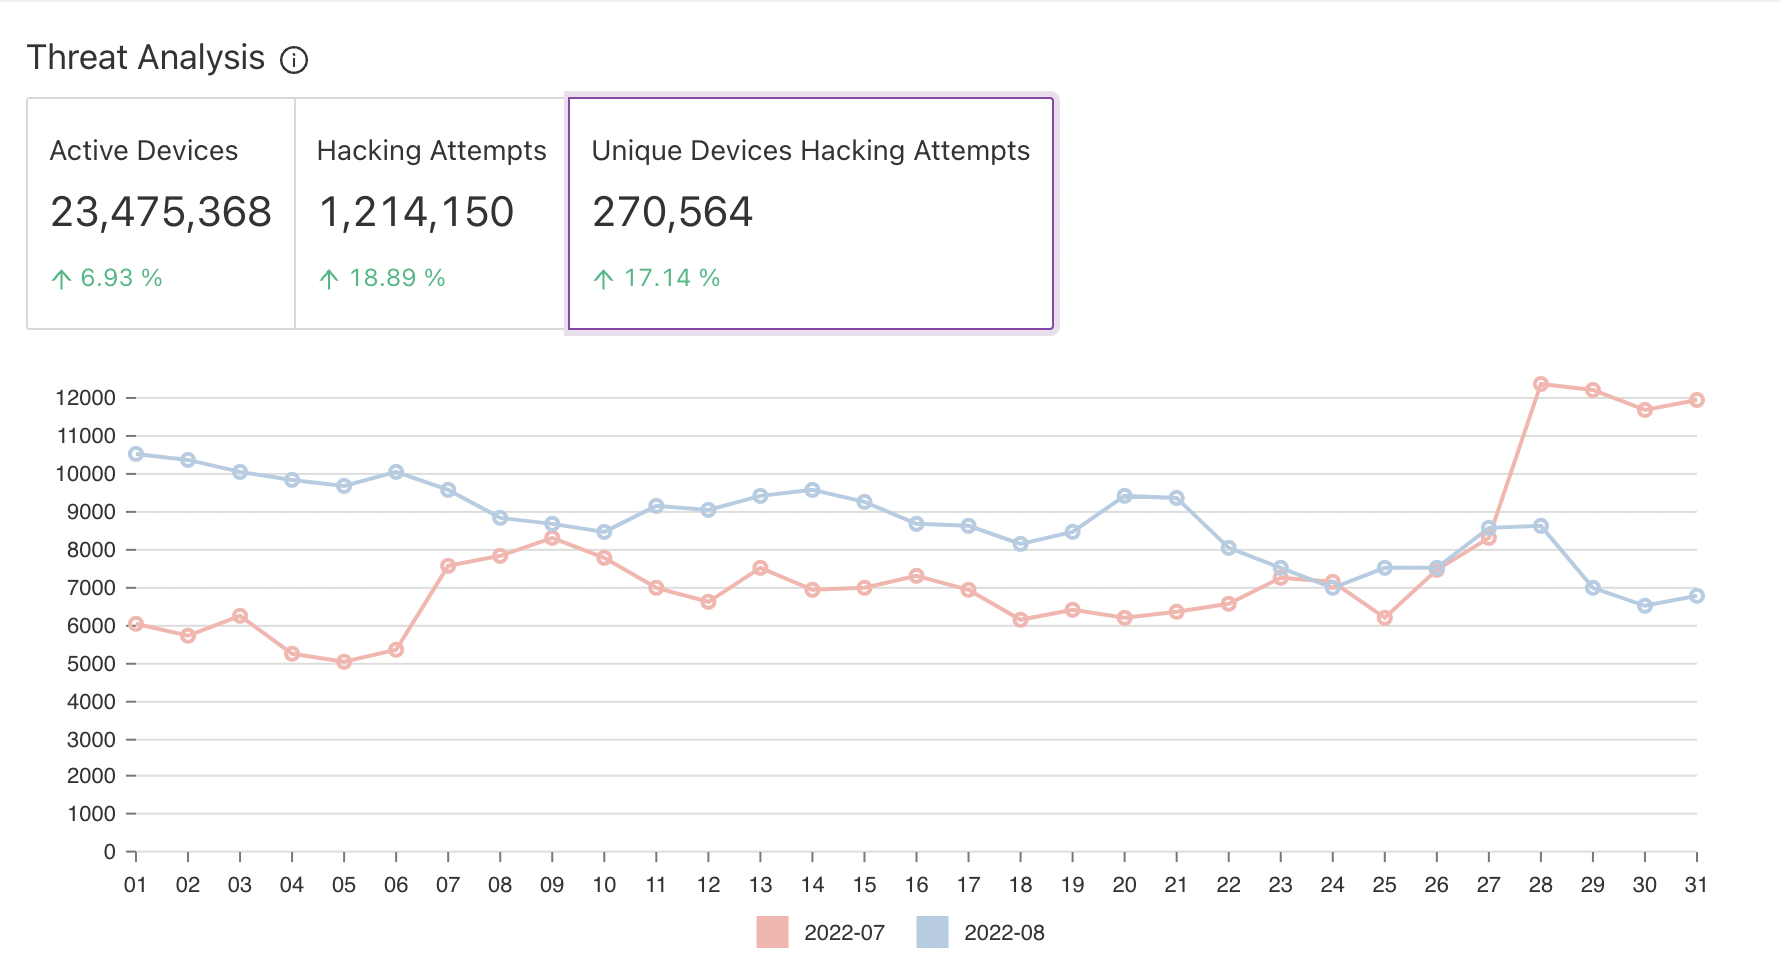
# Threat Analysis
Threat analysis is our in-product threat intelligence solution from expert AppSealing security researchers. It is designed to assist security teams to be efficient for managing emerging threats. Each threat analysis tab includes dynamic sections which give you overview about Hacking Summary for selected time period. To access each of this section, open the ADC Dashboard and select the required tab from Threat Analytics tile.
This also provide comparative analysis and trends from the historical data for same period selected in metrics.
The sections of Threat Analytics are as below:
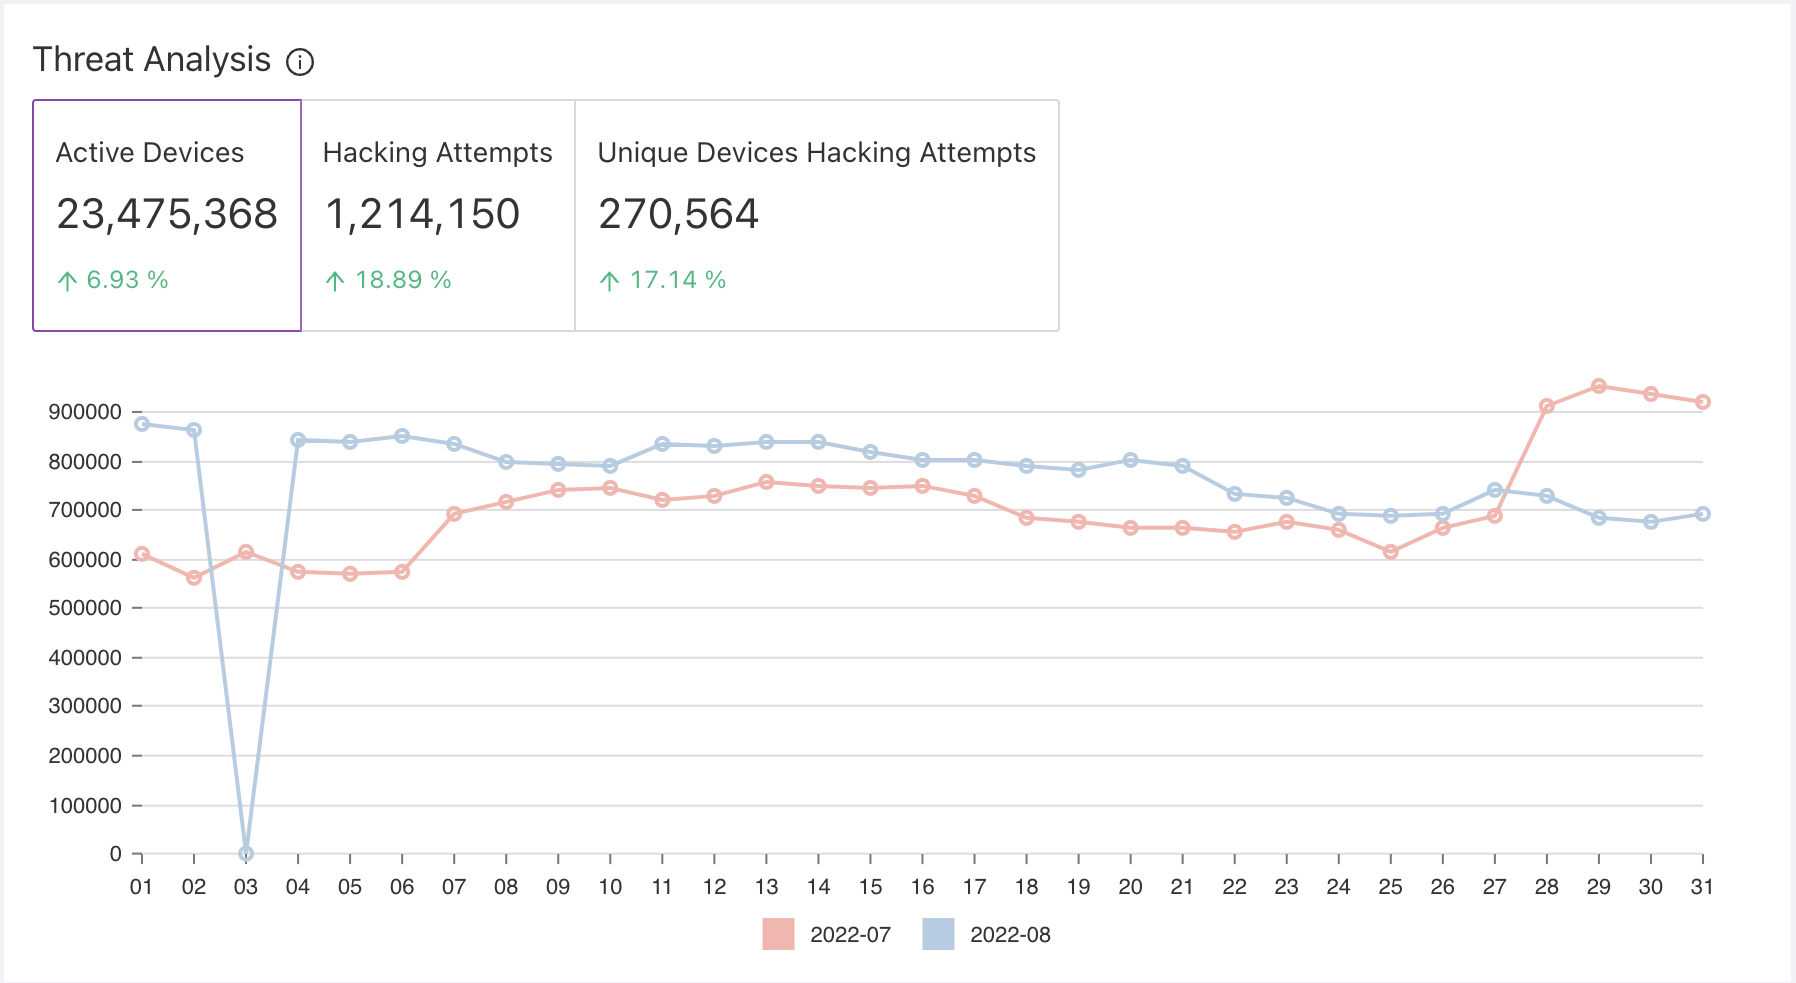
- Active Devices
This chart projects the summary of Active devices to developement and security team. It provides measures about number of users that have used the application on daily basis.
| Axis | Description |
|---|---|
| X-Axis | Date for the selected time period as well as previous month period |
| Y-Axis | Represents number of active devices detected by appsealing |
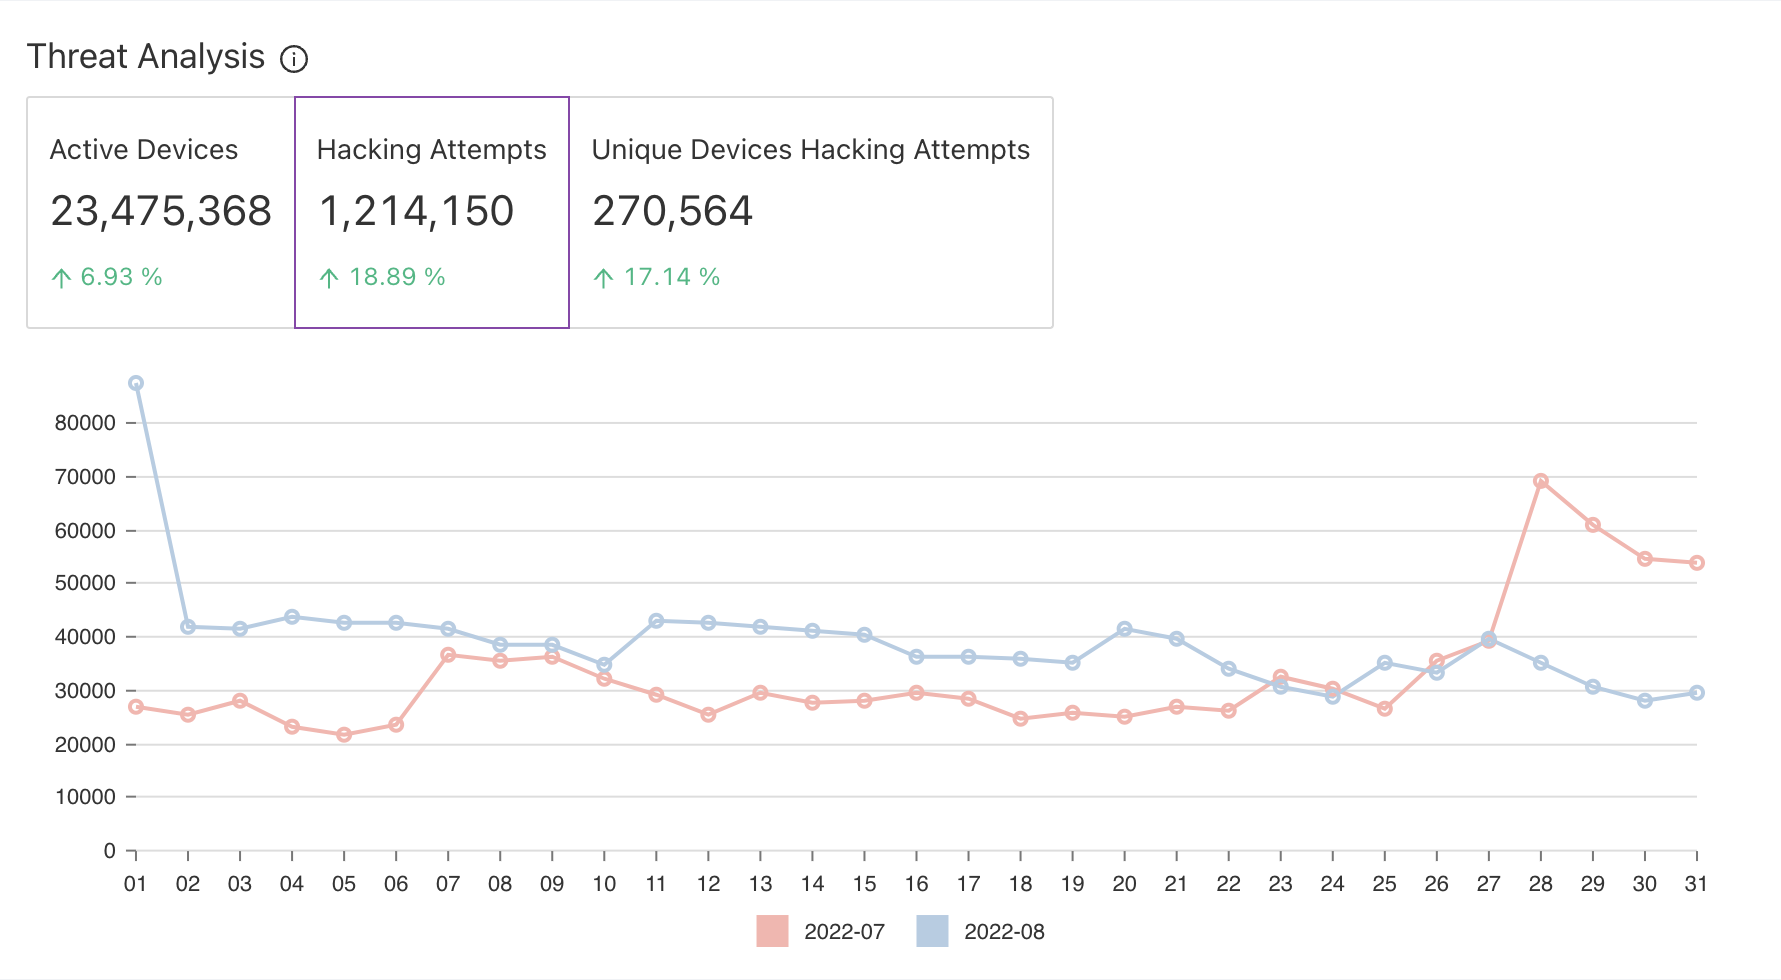
- Hacking Attempts
Appsealing build up security protection by providing security teams and developers with deep knowledge about hacking attemtps and allowing team to act on potential hacking attempts by blocking user access from their app.
| Axis | Description |
|---|---|
| X-Axis | Date for the selected time period as well as previous month period |
| Y-Axis | Represents number of hacking attempts for selected application |
- Unique Devices Hacking Attempts
Appsealing provides accurate information about uniquness to build trust from customers. Unique Devices Hacking Attempts gives the information for hacking attempts for unique number of devices. This can be helpful to block access to application from Android ID's shared in detailed page.
| Axis | Description |
|---|---|
| X-Axis | Date for the selected time period as well as previous month period |
| Y-Axis | Represents number of hacking attempts for selected application |
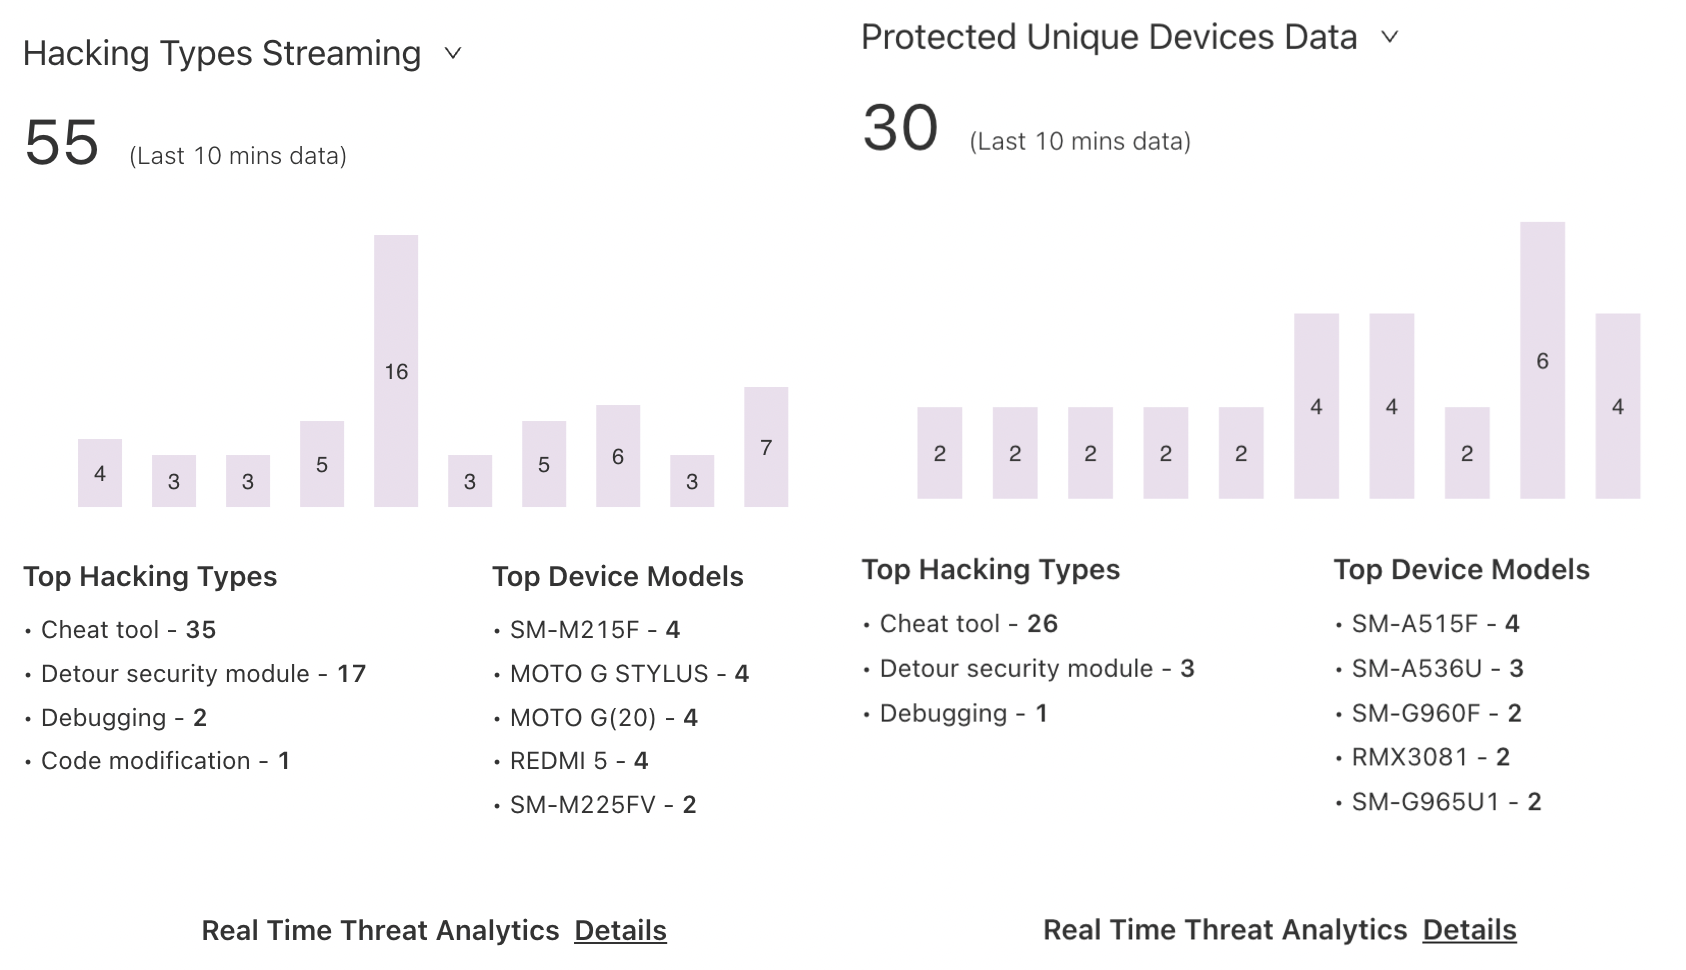
# Real Time Hacking Stream
Real-time Dashboard provides quick insights into the activity on your application, it displays graphs of hacking attempts and unique devices protect by AppSealing. The data is obtained from the Real-Time Reporting appsealing engine. It also provide top compromised device models and top hacking types to track common occurance for better security. This projects hacking attempts for last 10 minutes and auto fetched after every 1 minute.
User can toggle the streams by selecting required option from dropdown which is either Hacking Types Streaming or Protected Unique Devices Data
Using Real Time Hacking Stream gives you key insights into app activities, such as the following:
Unique Devices Hacking Attempts Unique Devices Hacking Attempts shows the number of total hacking attempts per minute occurred in last 10 mins along with top cheat tools and top device models compromised for security.
Protected Unique Devices Data Protected Unique Devices Data shows the number of total hacking attempts for unique devices per minute occurred in last 10 mins along with top cheat tools and top device models compromised for security.
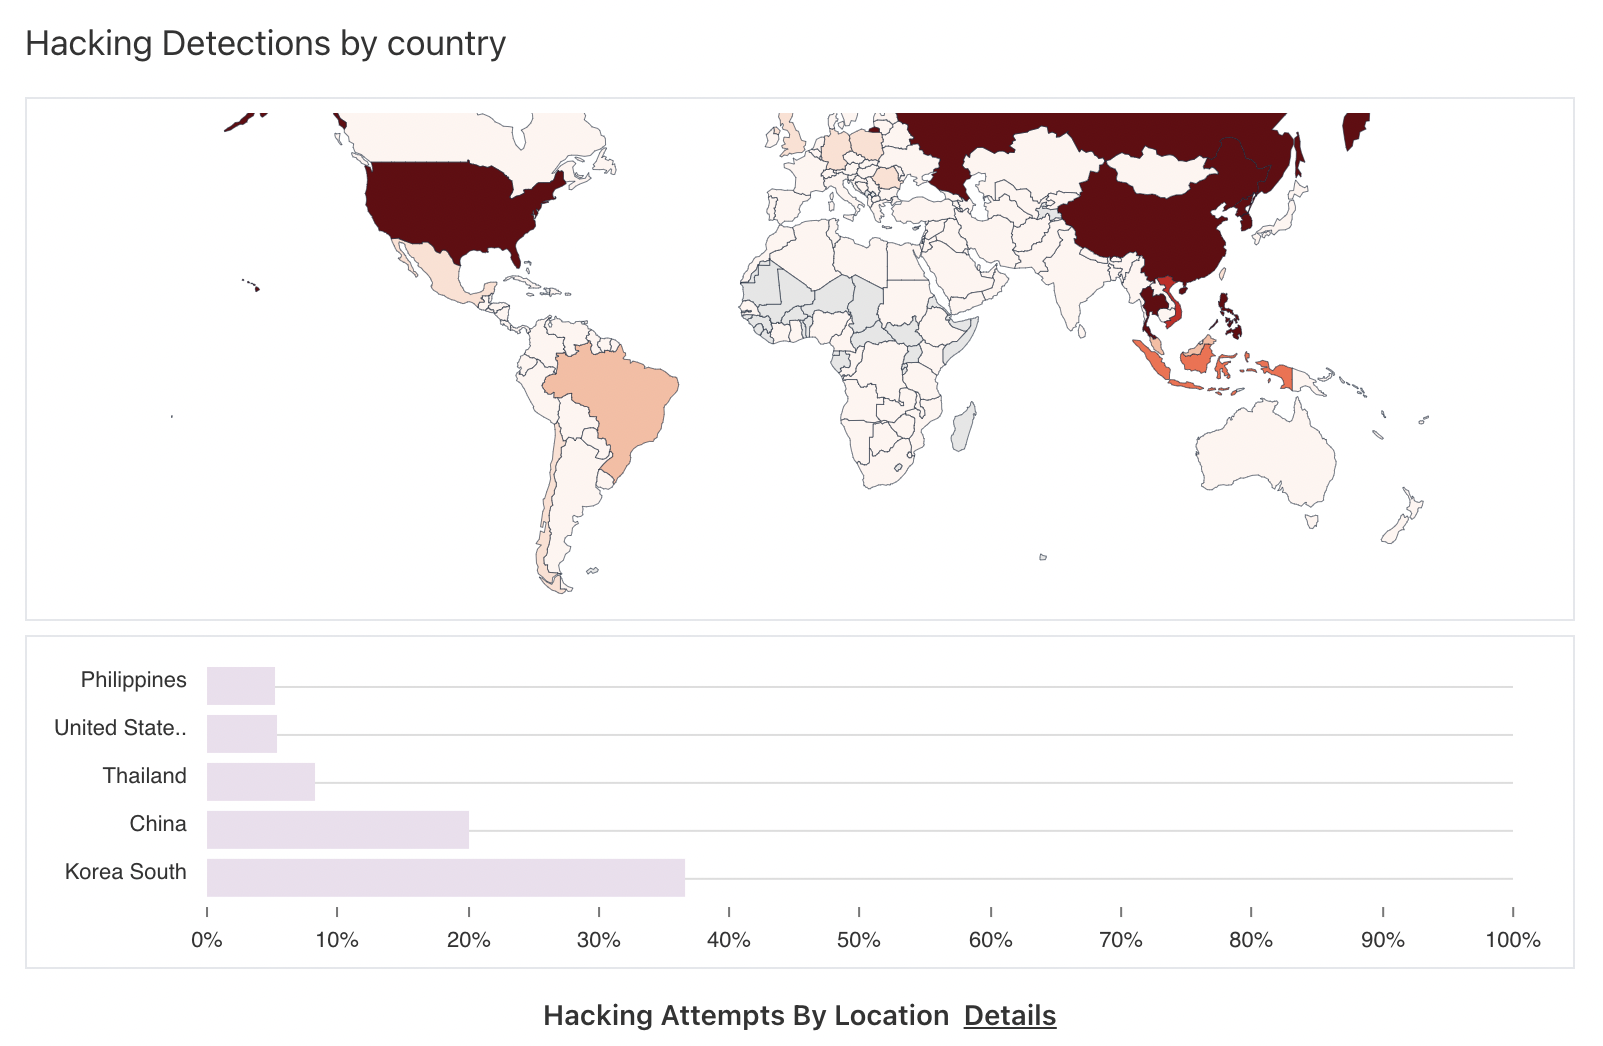
# Hacking Detections by country
Hacking Detections by country allows you to view a geographic representation of hacking attempted on your application with their hacking information overlaid for selected time period. It shows where hacking attempts are coming from with both Map and List View for top 5 countries to quick overview. Countries are highlighted from light to dark shade based on the number of attempts, higher the number darker shade for the country.
On hover over the countries in map as well list you will find Hacking Attempts, Unique Devices Attempts and average for both metrics over specific period.
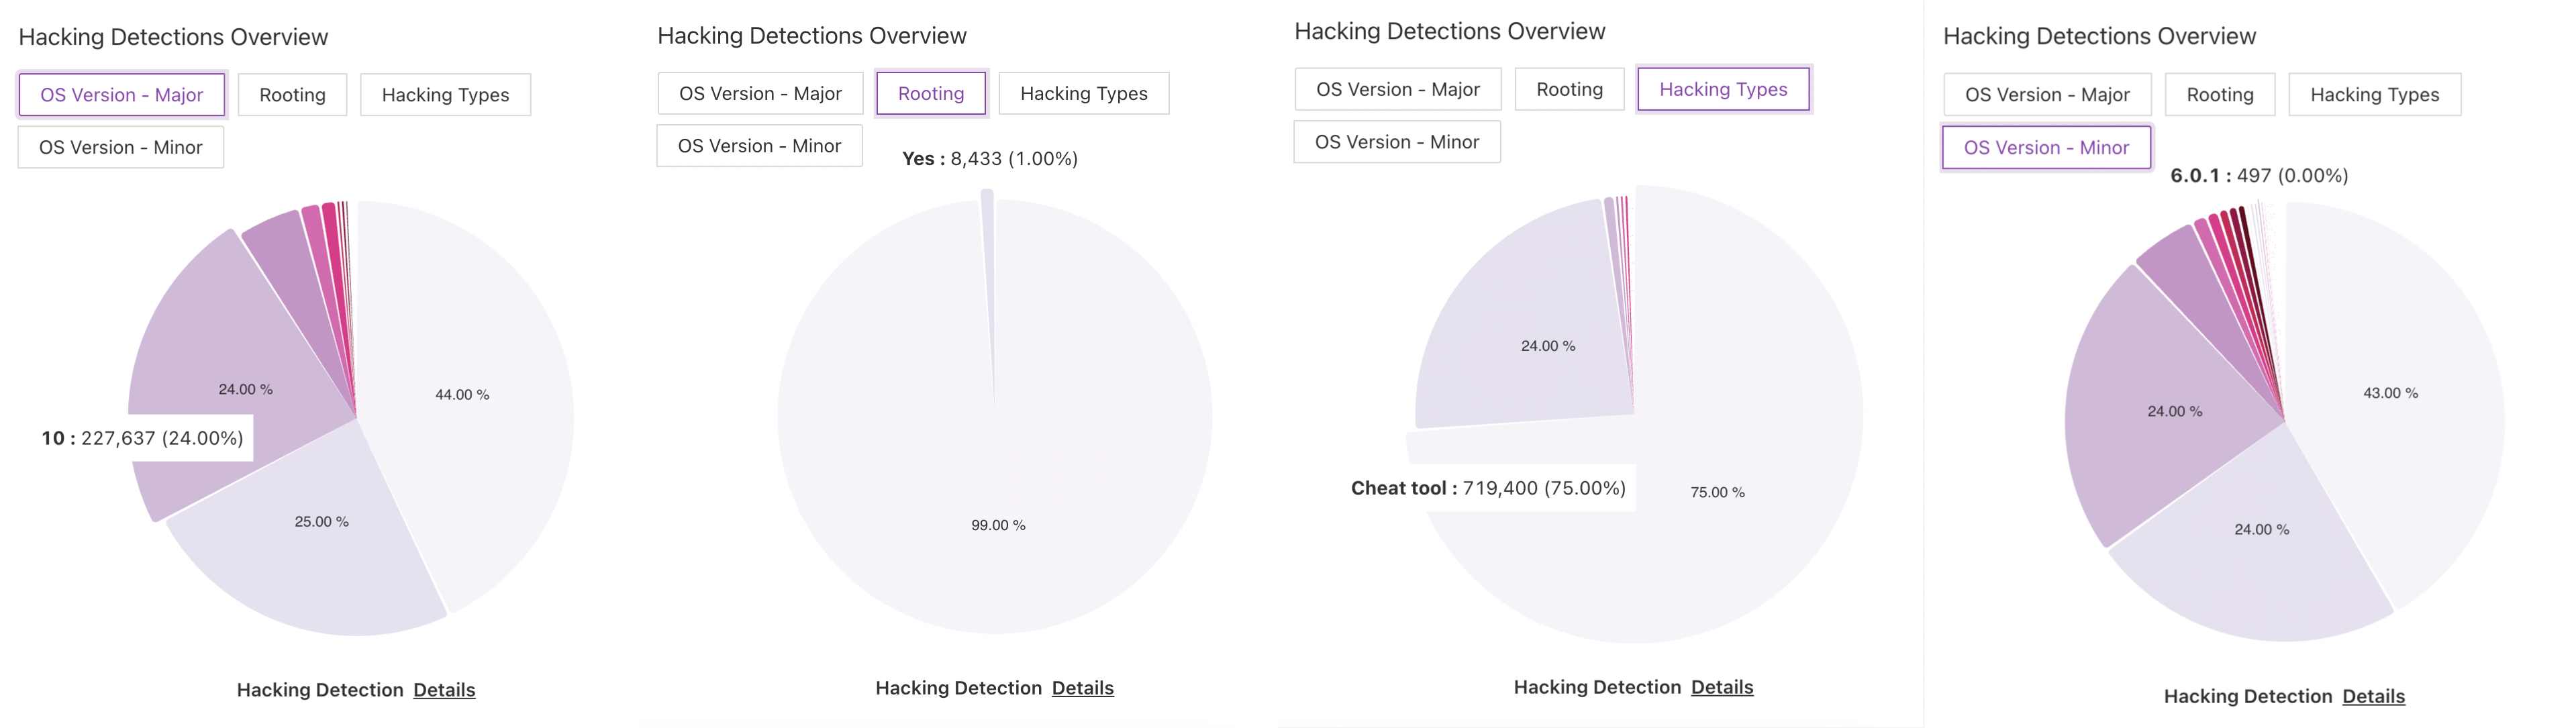
# Hacking Detections Overview
With unique metrics and smart visualizations from Hacking detection overview, you will get all detailed information about security. Each tab inside hacking detections overview consist of information in distributed format for analysis.
This includes
- Operating Systems - Major versions which are targeted for hacking attempts
- Rooting/Jailbreak - which contains rooting status for your applications
- Hacking Types/Patterns - includes distribution of threats occurred
- Operating Systems - Minor versions which are targeted for hacking attempts
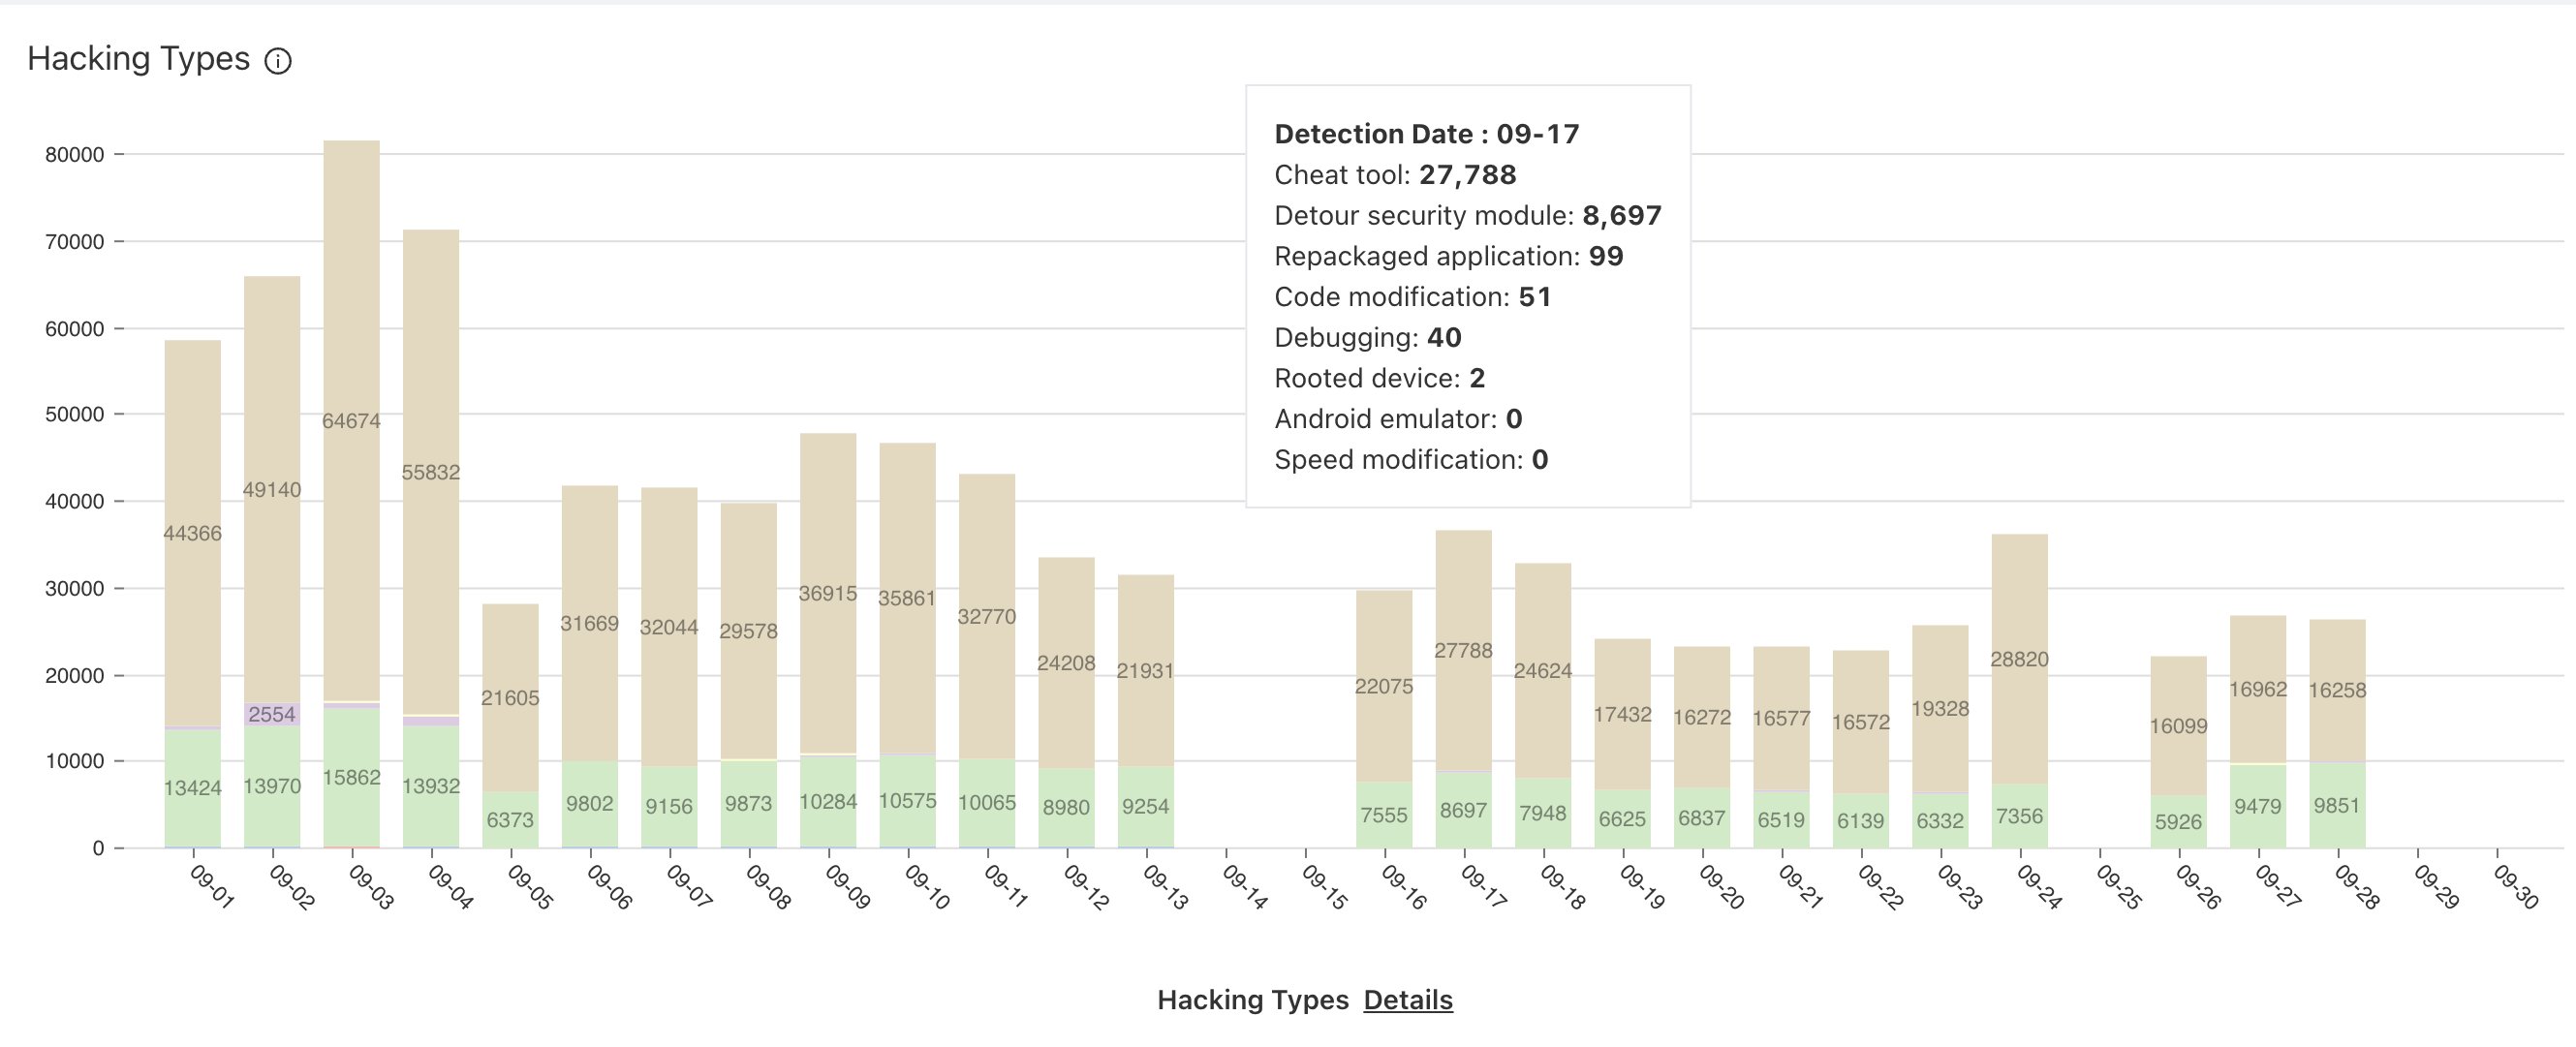
# Hacking Types
Hacking Type tile represents the identification of vulnerabilities on the application layer (for iOS and Android apps). It represents distribution of hacking attempts for selected time period.
| Axis | Description |
|---|---|
| X-Axis | Date for the selected time period |
| Y-Axis | Represents number of hacking attempts for selected application |
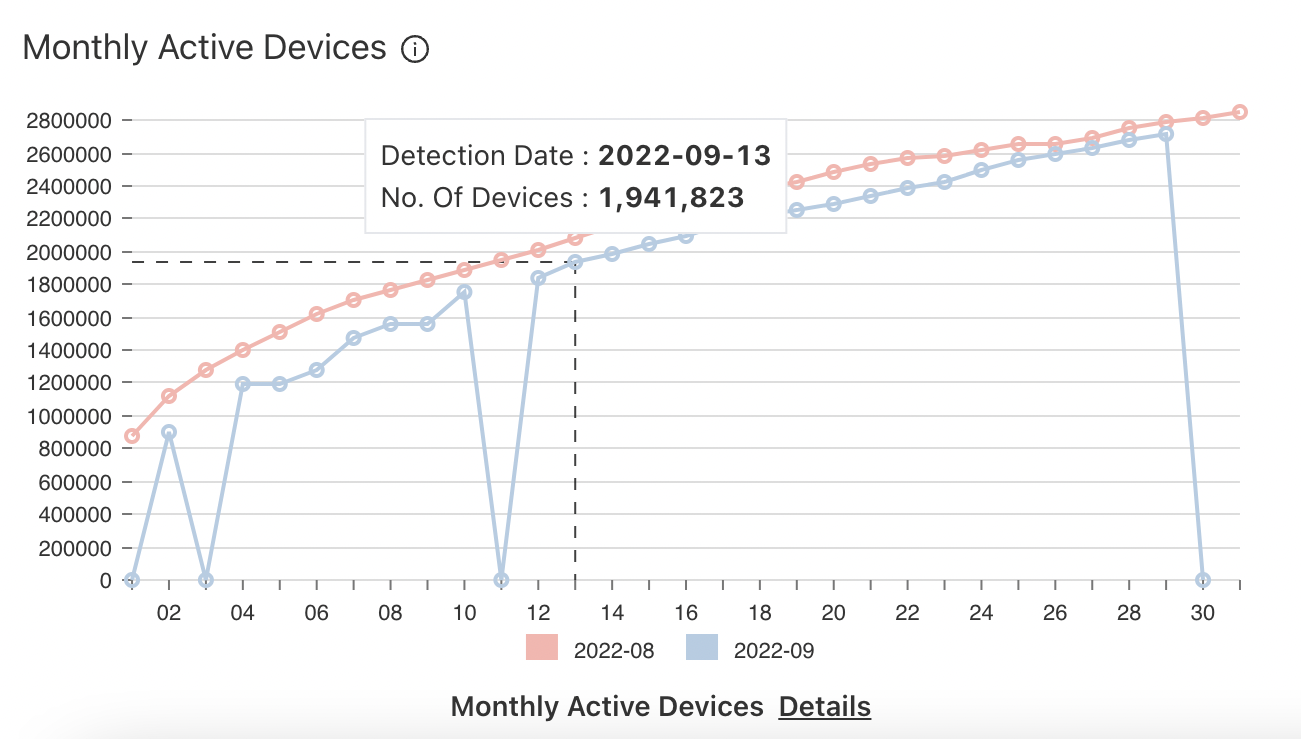
# Monthly Active Devices
The average number of active users per month who have used the app in a given period. We define an active user as a device having 1 or more foreground sessions within an app during the selected period.
| Axis | Description |
|---|---|
| X-Axis | Date for the selected time period as well as previous month period |
| Y-Axis | Represents number of devices active for selected application |
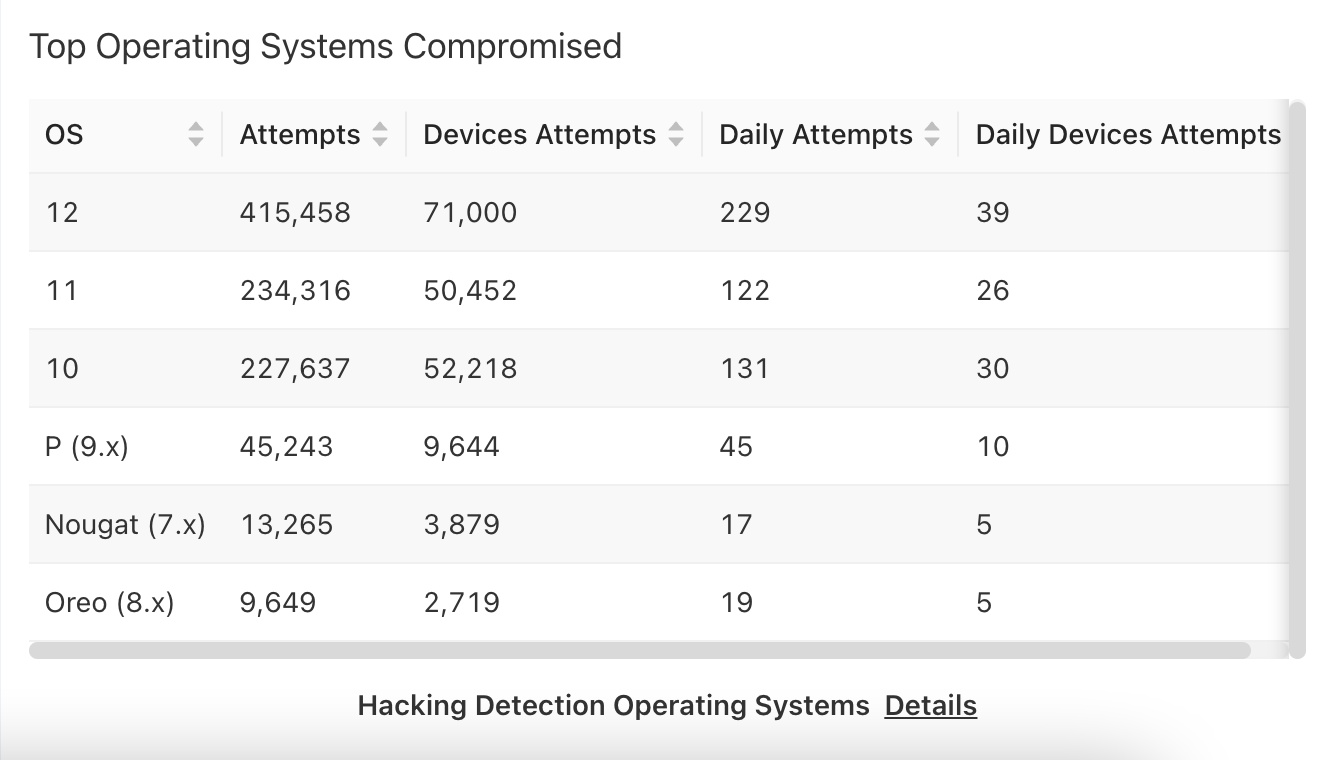
# Top Operating Systems Compromised
This matrix represents hacking information such as hacking attempts, devices attached and unique attempts corresponding with the Operating System. Data displayed for the Top Operating System on basis of number of hacking attempts tried on the device